“Being able to get reliable wind data remotely from satellites helps our meteorologists provide better forecasts and warnings”
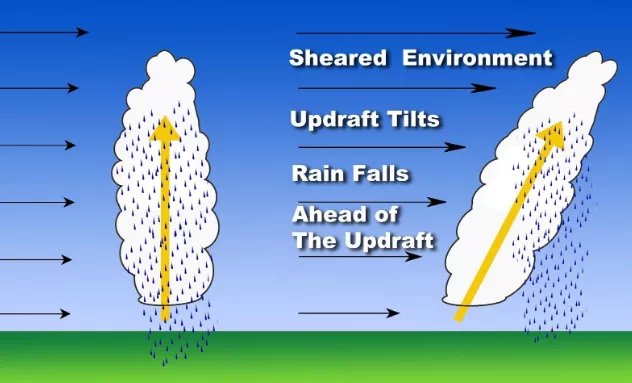
The wind is one of the fundamental variables in weather and its characterization is among the more important pieces of information contributing to the accuracy of global weather prediction models. Worldwide networks of ground weather stations provide nearly constant data on surface winds but, this only covers one aspect of the wind which can also vary in speed and direction with altitude – a quantity known as vertical wind shear. As an example, thunderstorms developing in an environment with little wind shear will produce a near vertical updraft resulting in a short lived rain shower once the heat source for the updraft has cooled, as shown schematically in the diagram below. When there is strong wind shear present, the updraft is tilted with the rain falling away from the surface source of the updraft resulting in a more sustained rainfall event.
Twice-daily deployments of weather balloons around the globe can make direct measurements of the winds and how they vary with altitude. Ground stations equipped with the appropriate radar and lidar instruments can also provide remote measurements of the winds aloft but they are comparatively limited in numbers and range. In order to get the wind data required for accurate weather modeling, scientists have relied increasingly on wind data from satellites to help fill the gaps. As explained by meteorologist Brian Jackson from the National Weather Service:
“Being able to get reliable wind data remotely from satellites helps our meteorologists provide better forecasts and warnings. Plus, satellite-derived wind data are especially important in areas where direct observations are unavailable, like sparsely populated locations, as well as over the ocean.”
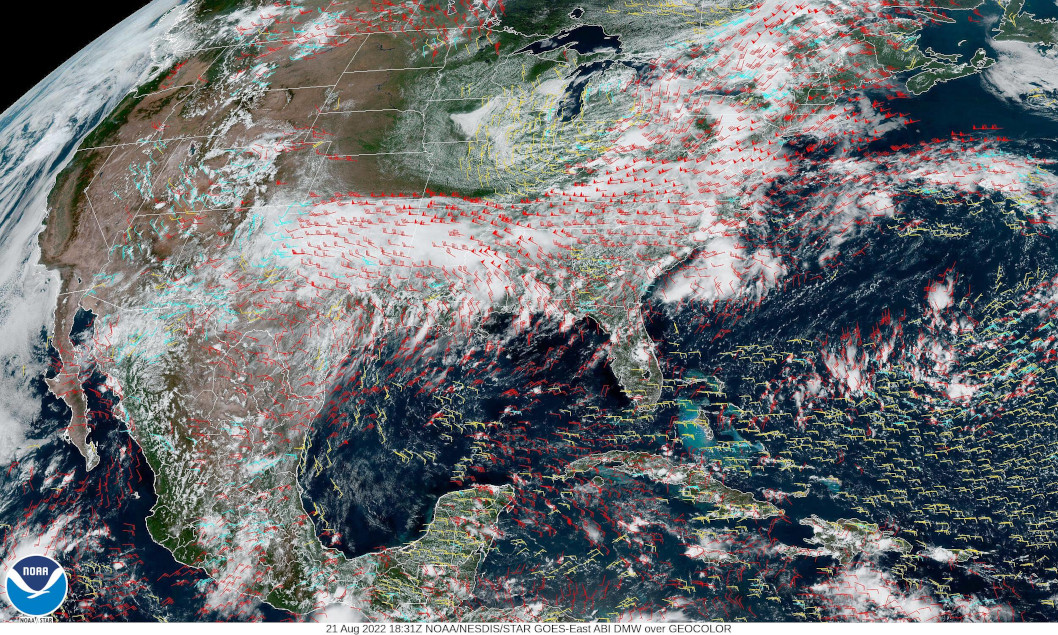
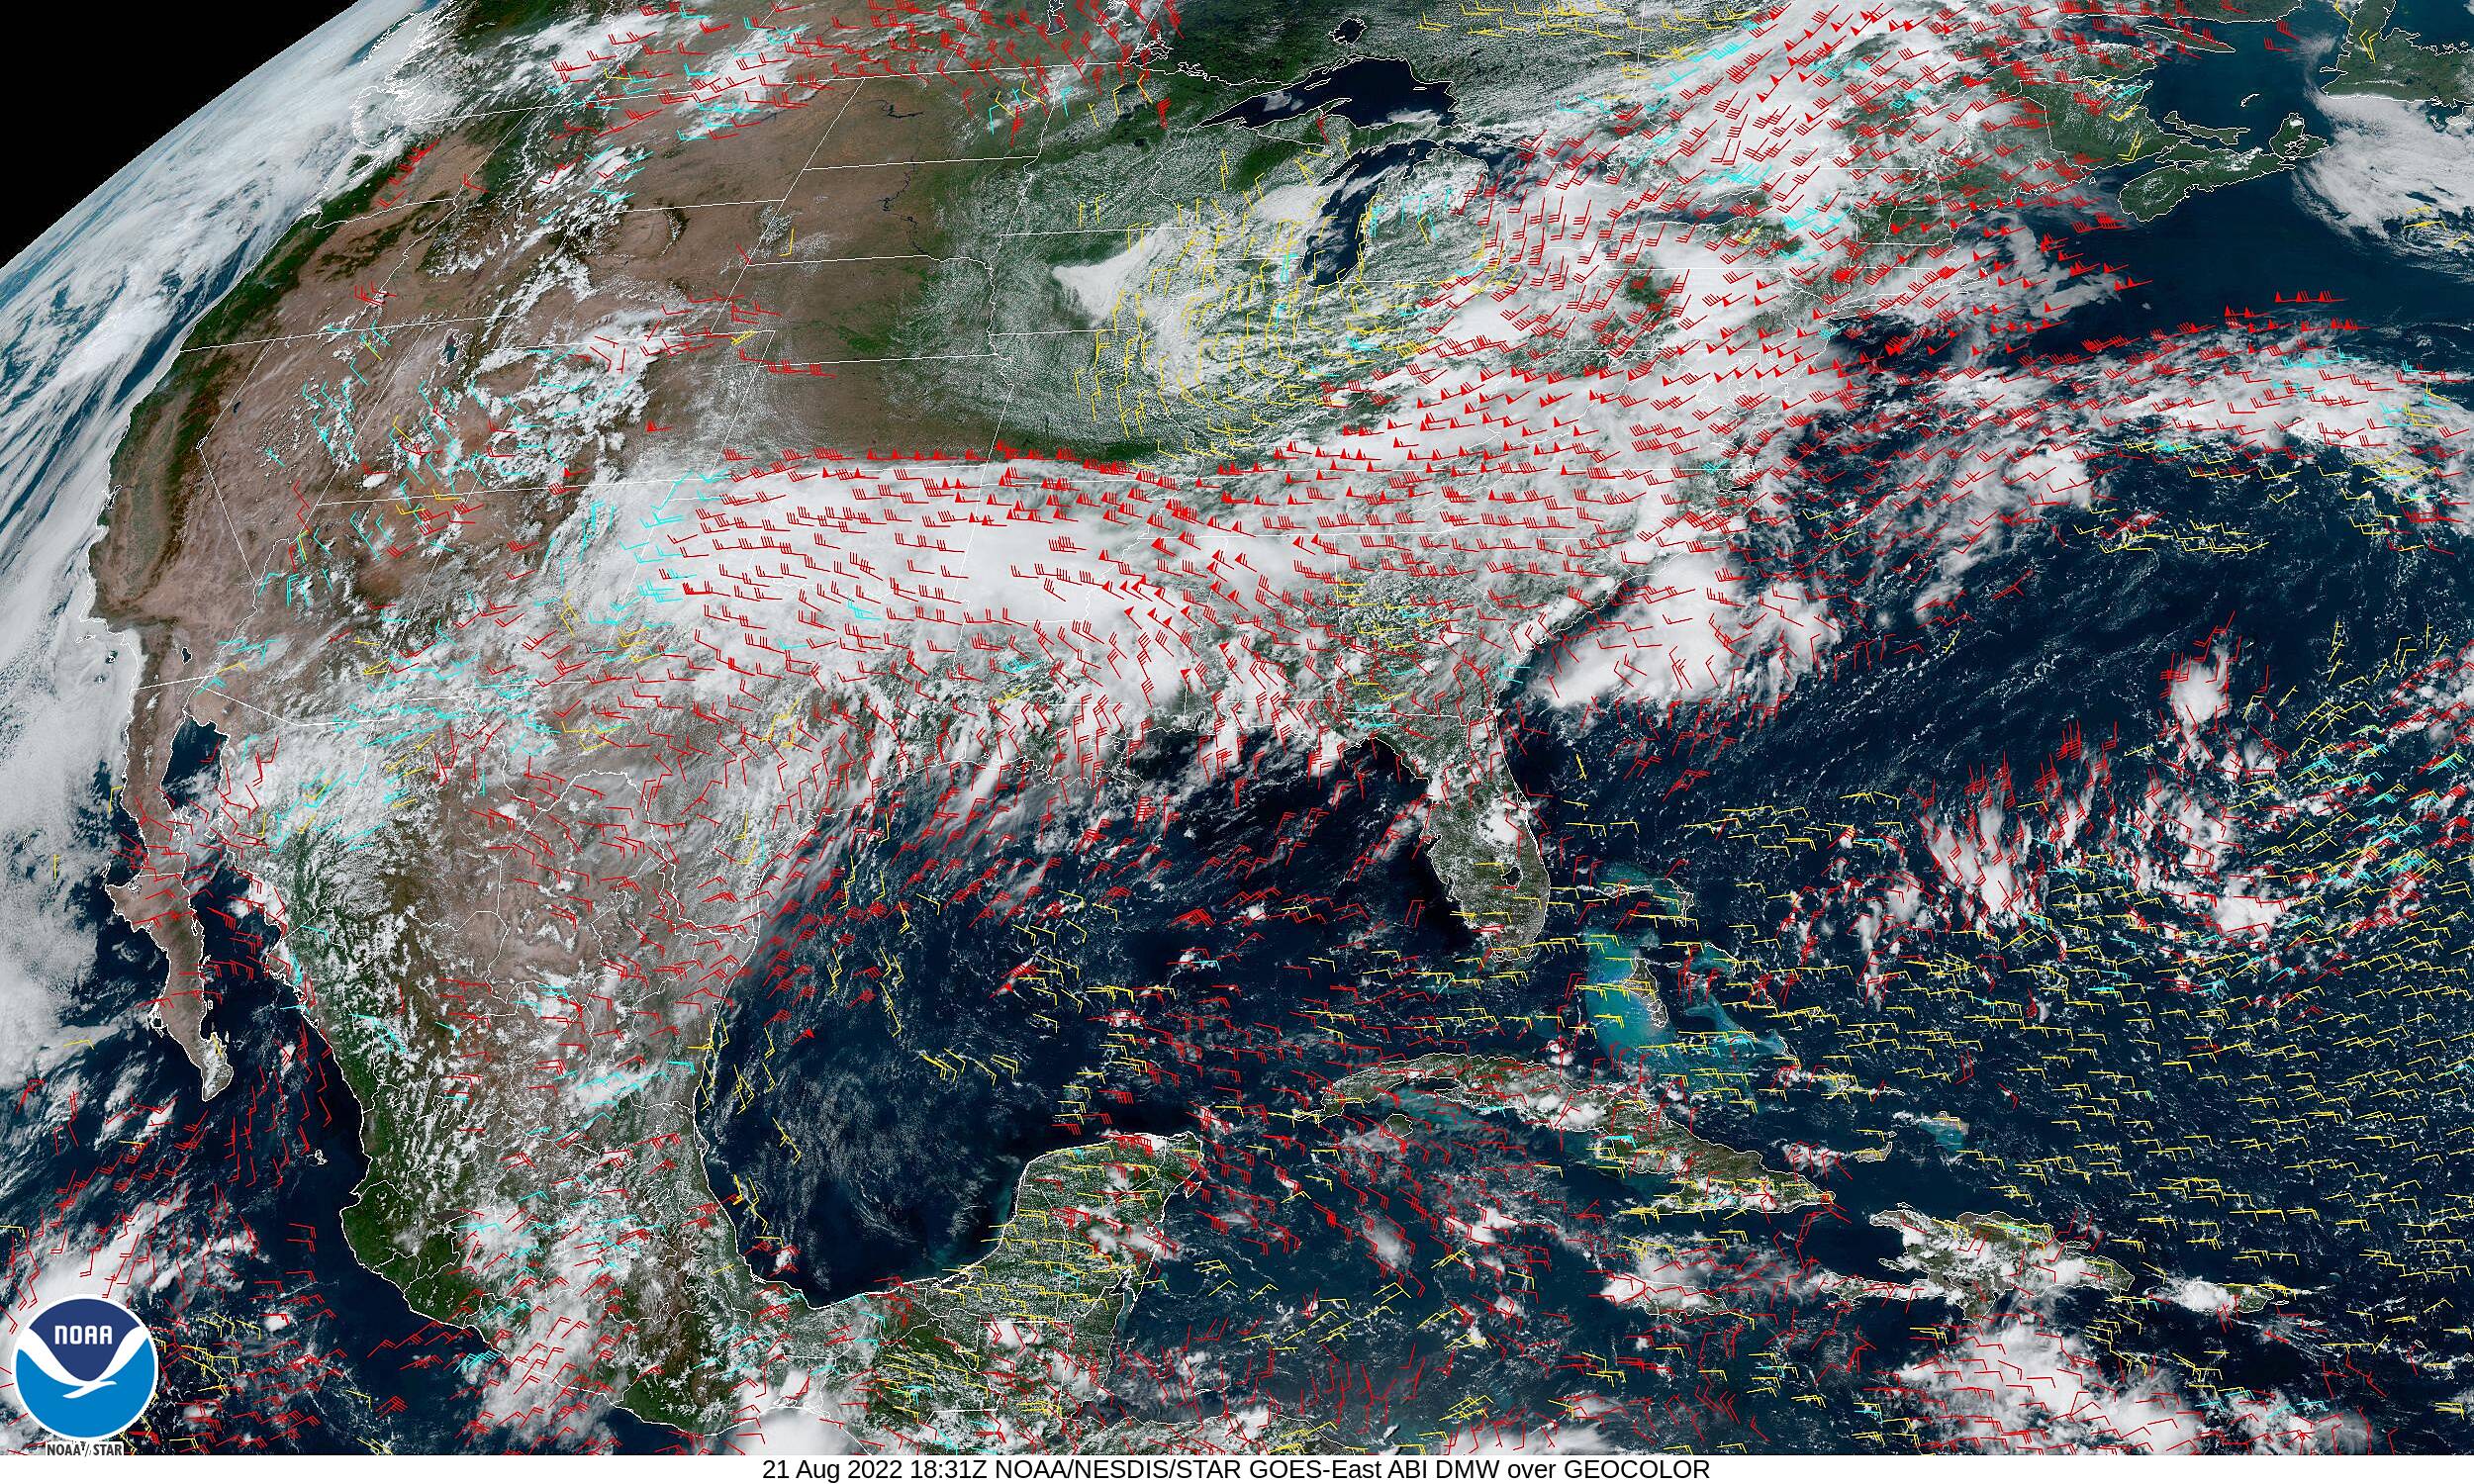
One widely used source of satellite wind data in weather models is NOAA’s Derived Motion Winds data product generated using imagery from the GOES series of weather satellites. Consisting of a pair of operational satellites in geosynchronous orbit, NOAA’s latest generation of GOES satellites provide high-resolution visible and infrared imagery as well as lightning observations of more than half the globe centered on the continental United States (CONUS). By tracking the positions of clouds or feature caused by water vapor variations in a succession of three images, the wind speed and direction can be determined over large swaths of the globe with a new measurement of winds provided every 15 minutes over CONUS and every hour elsewhere. With the altitude of the features being tracked inferred from infrared sounding measurements, the Derived Motion Winds data product can provide wind measurements at a range of altitudes needed to characterize vertical wind shear.
While the Derived Motion Winds data product provides vital inputs for weather models, it does suffer from a number of drawbacks. Aside from the coarse horizontal resolution (about 38 kilometers) and modest accuracy in wind speed (about 7.5 meters/second), the altitude resolution is very poor affecting the accurate characterization of wind shear. Typically, the atmosphere is broken up into three broad altitude bins: less than 3 kilometers, 3 to 7 kilometers, and 7 to 14 kilometers. Additionally, there is no measurement of vertical winds, which would be common near powerful thunderstorms, with all apparent motion of cloud features assumed to be the result horizontal movement. Finally, measurements poleward of about 55° latitude are not available due to oblique viewing conditions from the GOES satellites’ equatorial orbit. This impacts the availability of data for northern regions like Alaska and much of Canada. This limitation can also affect the characterization of the polar vortex which has been responsible for severe winter weather in North America and elsewhere (see “Satellite Observations of the Polar Vortex and Jet Streams”).
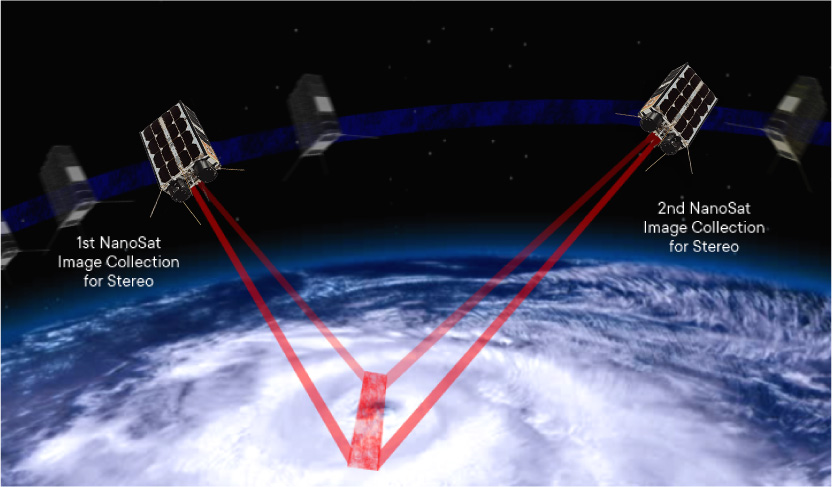
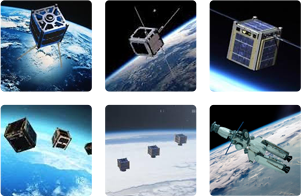
The Hurricane Hunter Satellite constellation, currently under development by Tropical Weather Analytics, Inc., will provide data on winds over large areas with unprecedented resolution and accuracy. Consisting of five pairs of 6U CubeSats with their orbital planes spaced across the globe, this constellation will use its 100-meter class imagery for stereographic analysis to precisely locate not only the latitude and longitude of cloud features in a typical 2,000×2,000-kilometer scene, but also measure their altitudes to an accuracy of 100 meters.
By tracking changes in the precise positions of cloud features over time, much as is done with NOAA’s Derived Motion Winds data product, but in 3D, analysis of the Hurricane Hunter Satellites’ stereographic imagery can determine wind speeds based on the motion of cloud features as small as 300 to 500 meters to an accuracy of about one meter/second, including unique measurements of vertical winds which no other satellite-based method measures. These high resolution wind measurements will provide accurate data not only on wind shear, but also the vertical velocity of updrafts at a resolution sufficient to characterize the conditions in individual storm cells.
Comparison of GOES Derived Motion Winds and Hurricane Hunter Satellite Wind Data Products
| GOES | Hurricane Hunter Satellites | |
| Geographic Coverage | Between ±55° latitude | Global |
| Horizontal Resolution | 38 km | 0.3 to 0.5 km |
| Vertical Resolution | 3 to 7 km | ~0.1 km |
| Mapping Accuracy | 5 km | ~0.1 km |
| Wind Speed Accuracy | 7.5 m/s | ~1 m/s |
| Vertical Winds | No | Yes |
In a typical 2,000×2,000-kilometer scene, the stereographic imagery acquired by the Hurricane Hunter Satellite will have hundreds of thousands of wind measurement data points, compared to the Derived Motion Winds data product which supplies only thousands of data point at best for the same scene. With a full constellation of five satellite pairs, any point on the Earth can be observed every 2½ hours to provide information on cloud cover, cloud top altitudes, and 3D winds. This orders of magnitude increase in the number of precisely located wind measurements over a range of altitudes promises huge improvements in weather forecasting especially for high-resolution mesoscale weather models.
References
“Measuring Winds to Help Predict the Weather”, National Environmental Satellite Data and Information Service Website, November 19, 2019 [Post]
Jaime Daniels et al., “GOES-R Advanced Baseline Imager (ABI) Algorithm Theoretical Basis Document For Derived Motion Winds”, NOAA NESDIS Center for Satellite Applications and Research, Version 3.1 February 2019 [Document]
Related Reading
Drew LePage, “The Hurricane Hunter Satellites”, Drew Ex Machina, May 15, 2022 [Post]
Jay Jordano, “Satellite Observations of the Polar Vortex and Jet Streams”, TWA Blog, July 29, 2022 [Post]
Jay Jordano, “The Jet Streams and Their Future Characterization”, TWA Blog, July 18, 2022 [Post]
Drew LePage, “How Satellite Wind Data Impacts Weather Forecasting”, TWA Blog, May 23, 2022 [Post]